
The real secret to measuring training effectiveness? It's not about one magic number. It's about telling a story that connects learning to what people actually do on the job—and how that behavior moves the needle for the business. This means weaving modern instructional design theory with the latest software trends.
This means you have to look at both the hard numbers, like quiz scores from your Learning Management System (LMS), and the softer, more human feedback, like observations from managers over time. A smart strategy goes way beyond just tracking who finished a course and starts proving real, tangible business impact by leveraging tools like AI, microlearning, and authoring suites.

For far too long, "training success" was just a checkbox on a report. Did everyone complete the module? Great, our job is done. But that old-school thinking tells you absolutely nothing about whether the training actually worked, and it often leads to a massive financial drain. It's time to stop tracking busywork and start measuring outcomes.
Think about the investment. U.S. companies alone pour over $100 billion into training programs every single year. But when that training doesn't stick, the losses are staggering. It's estimated that organizations lose a whopping $13.5 billion annually for every 1,000 employees, simply because people don't retain knowledge or apply their new skills.
A modern approach means you have to tie every learning initiative directly back to a business goal. It doesn't matter if you're aiming for better performance reviews, higher sales numbers, or happier customers—your measurement strategy has to reflect that specific target.
Getting this right involves blending classic instructional design with the tools we have today. This is where we see the latest trends in instructional design theory meet software.
The goal is to build a narrative supported by data. Instead of just saying '85% of the sales team completed the training,' you can say, 'After the training, the sales team's average deal size increased by 15% in Q3.'
Measuring training effectiveness can feel like a big puzzle. For years, we relied on simple, activity-based metrics that were easy to track but didn't tell us much. The table below shows how the thinking has shifted from just tracking activity to truly measuring impact, incorporating new instructional design trends.
Relying only on completion rates is the ultimate vanity metric. It looks good on a PowerPoint slide, but it doesn't answer the questions that really matter to the business.
Instead of focusing on who finished, start asking:
This kind of immediate, on-the-ground feedback is a key part of what’s known as formative evaluation. It's all about checking in early and often to make sure the program is on the right track. You can dive deeper into this topic in our guide on the definition of formative evaluation.
By moving past the surface-level data, you start to uncover the real story of your training's value. That's how you prove that L&D isn't just a cost center—it's a critical driver of business success.
Before you can measure anything, you need a solid plan. Just diving in and collecting data without a framework is like trying to build a house without a blueprint. You'll end up with a mess of disconnected information and no real way to prove success. A structured approach is absolutely critical to tell the full story of your training's impact.
One of the most trusted and battle-tested frameworks out there is the Kirkpatrick Model. I know what you might be thinking—it was developed way back in the 1950s. But its four-level approach is still the gold standard for L&D pros because it provides a clear, logical path from a learner's initial reaction all the way to tangible business results. This isn't just some dusty academic theory; it's a practical roadmap that connects learning to performance.
This first level is all about the immediate gut check. Did your team actually like the training? Did they find it relevant, engaging, and worth their time? This is your first impression, and it matters a lot.
Measuring reaction is usually straightforward. You can use simple post-session surveys, quick polls in your LMS or LXP, or even informal chats. Ask pointed questions like, "Was the content directly applicable to your daily tasks?" or "Did the instructor keep you engaged?" This feedback tells you right away if the training landed well.
Okay, they liked it. But did they actually learn anything? This is where you confirm that knowledge was actually transferred. You’re measuring the "aha!" moments—the increase in knowledge, skills, and even confidence.
This stage leans more on hard data. Here are a few ways I've seen this done effectively:
This is where the rubber really meets the road. Are people taking what they learned in the classroom and applying it to their jobs? This is the step most companies skip, but it’s where you start to see real, meaningful change.
Measuring behavior isn't a one-and-done thing. You have to look at performance over time, usually 30-90 days after the training wraps up. This could involve manager check-ins, 360-degree feedback, or even digging into performance data for specific tasks. Following good instructional design best practices means building in follow-up activities from the start to nudge people toward applying their new skills.
The goal here is a visible shift in how people work. After a feedback workshop, for instance, are managers having more constructive one-on-ones? That’s the behavior change you’re looking for.
Finally, the big one. How did the training impact the bottom line? This is where you connect the dots between your program and the company's biggest goals. We're talking about things like increased sales, higher customer satisfaction scores, fewer production errors, or better employee retention.
This is all about aligning your training objectives with the right evaluation tools to capture the full picture.
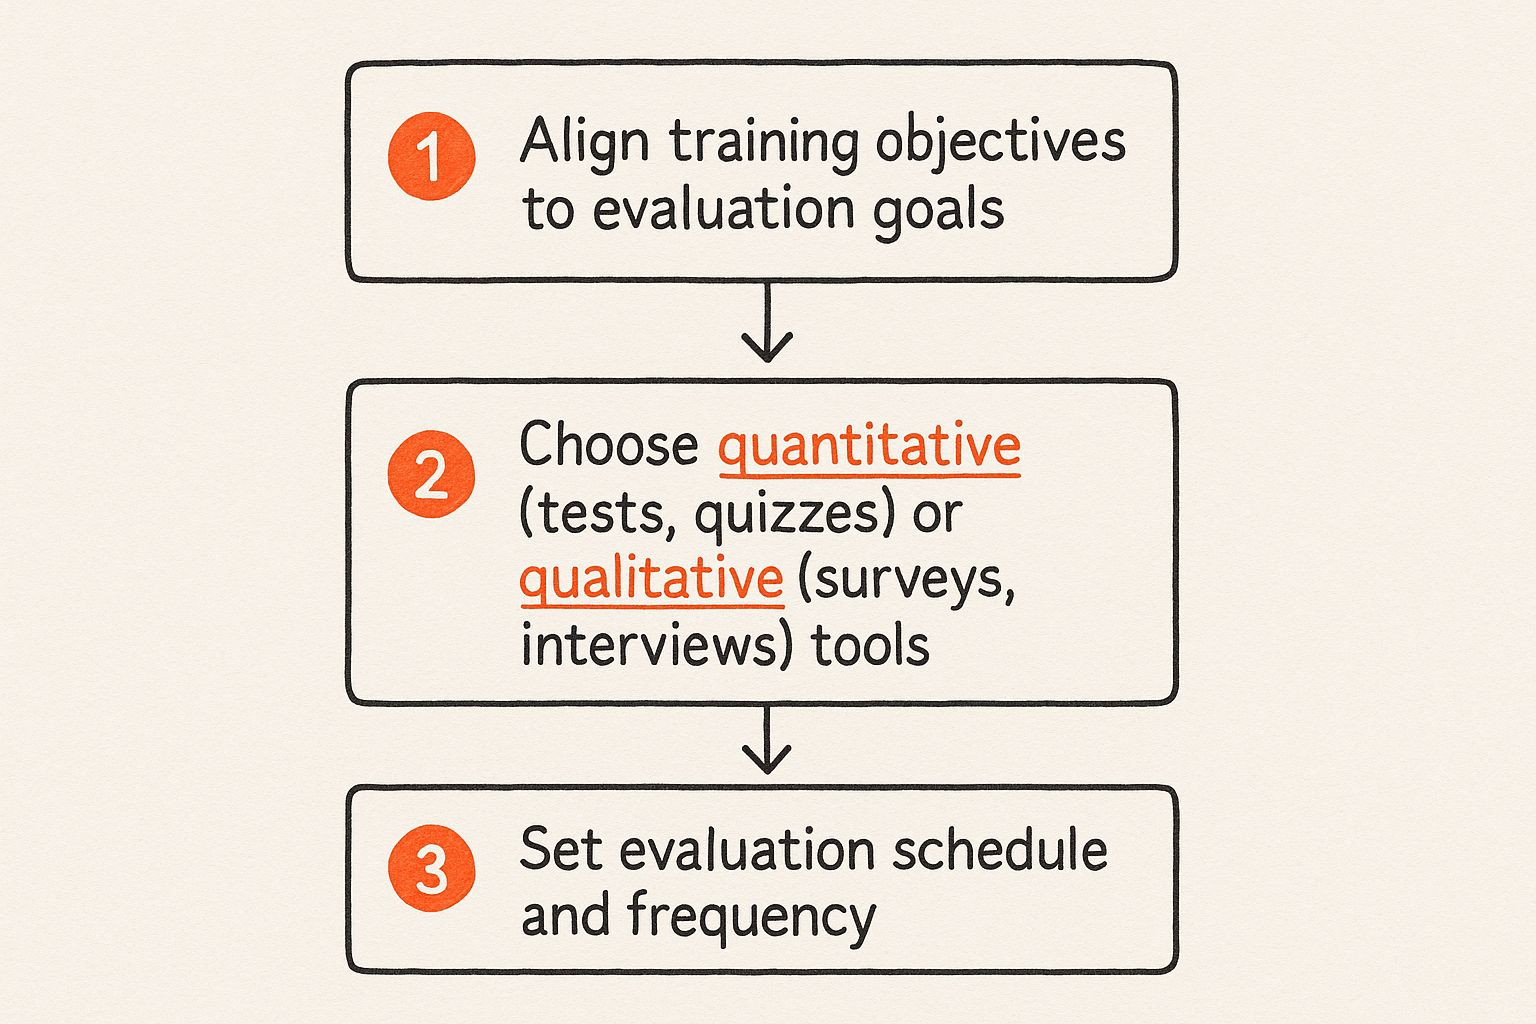
The image above really drives home the need for a deliberate strategy. You start with high-level goals and then pick the right mix of methods to measure them. By working through each level of the Kirkpatrick Model, you're not just collecting data—you're building a compelling business case that proves the true value of your training.

If you're still wrestling with manual data entry and clunky spreadsheets, it's time for an upgrade. Honestly, those methods belong in the past. Today's instructional design tech doesn't just make data collection easier; it gives you much deeper, more meaningful insights into whether your training is actually working.
Tapping into the right tech stack handles the grunt work for you. This frees you up to do what really matters: dig into the data and figure out what it’s telling you.
Modern Learning Management Systems (LMS) and the more intuitive Learning Experience Platforms (LXP) are at the heart of this change. These platforms are absolute data goldmines. They automatically track so much more than just who finished a course. We're talking engagement times, detailed assessment scores, and even how people move through different learning paths.
This is where you can get really smart with data collection. Authoring tools like the Articulate Suite or Adobe Captivate let you build measurement right into the training itself. It’s a game-changer, especially for microlearning, where you need to see if those quick-hit lessons are actually sticking.
Instead of just tacking a quiz on at the end, instructional design theory now pushes for weaving interactive checks throughout your modules. It gives you a much richer picture of what's going on.
For instance, you could include:
This approach gives you a constant flow of performance data. Let's say you notice 75% of learners are fumbling a specific scenario in a new compliance module. Boom. You've just pinpointed a critical knowledge gap that needs immediate attention. A simple pass/fail score at the end would have completely missed that nuance.
The real beauty of modern authoring tools is they turn your content into a data-gathering machine. Every click, every answer, every hesitation can become a valuable piece of the puzzle.
Now, let's talk about Artificial Intelligence. AI is a major trend in instructional design, taking this a step further by adding a layer of real sophistication. The AI algorithms baked into many LXPs can analyze user data to spot trends you'd never see on your own. They can even predict which learners are likely to fall behind.
This means you can step in before someone gets stuck. The system might automatically suggest some extra reading or even ping their manager for a quick check-in.
Imagine an AI noticing a sales rep keeps bombing the quiz questions about a new product feature. It could instantly push a short, targeted microlearning video to them that explains just that function. This not only personalizes their learning experience but also gives you fantastic data on which product features are causing the most confusion across the entire team.
When you set up your tech to automate this kind of data gathering, you shift from being reactive to proactive. You’re no longer just chasing down numbers to fill out a report; you’re uncovering the story behind the numbers and using it to make your training better every single day.
Hard data is great, but let's be honest—numbers alone don't paint the full picture.
Think about it. Your LMS might show a neat 20% jump in assessment scores after a new sales training. That's a solid win, but it doesn't tell you why it worked. Did the team finally feel more confident talking about the new product line? Were those new microlearning modules actually engaging, or just easy to click through?
To get the real story, you have to bring in the human element.
The best way to measure training effectiveness is to blend the hard data (quantitative) with the human experience (qualitative). This mixed-method approach helps you move beyond just what happened and dig into the reasons behind it, creating a much more compelling narrative for your stakeholders.
The quantitative piece is your foundation. This is the objective, measurable data you can pull from your learning platforms, business dashboards, and performance trackers. It's the proof that something changed.
You’re probably already gathering some of this without even realizing it. Common sources include:
These numbers are crucial for showing a tangible return on investment. They are the "what" in your story.
While the numbers tell you what changed, the qualitative side tells you why it mattered. This is where you collect the stories, opinions, and observations that give your data color and context. You're trying to understand the actual human experience of the training.
This is where good instructional design really proves its worth. A mixed-method approach is pretty much industry standard now, combining data from an LMS or LXP with rich feedback from surveys and observations to create a feedback loop for continuous improvement. This is how you deliver clear, actionable findings to leadership. You can see how experts are measuring training effectiveness at Whatfix.com for more on this.
To get this kind of feedback, you need to ask better questions than just "Did you like the training?"
A 15% jump in team productivity is a great headline. But pairing it with quotes from team members saying the new software training made them feel "less stressed and more efficient" is what makes your case unforgettable.
Here are a few effective ways to gather those qualitative insights:
Combining both quantitative and qualitative methods gives you a complete, 360-degree view of your training's impact. Here’s a quick look at how different techniques can be used to gather different types of data.
By weaving these two data types together, you’re no longer just presenting a spreadsheet. You're telling a powerful story of impact, one that’s backed by both solid evidence and genuine human experience.

Alright, you’ve gathered all this great data from your LMS, surveys, and manager check-ins. So... now what? Raw information is interesting, but its real power comes alive when you turn it into a story that actually drives change. This is the final, crucial step where we move from just collecting data to truly analyzing it and sharing what we’ve learned.
This is where you connect the dots. You’ll finally be able to show a direct line from your training initiatives to real business outcomes. It’s your chance to prove that L&D isn't just a cost center, but a strategic partner that delivers tangible value.
First things first, you have to dive into the numbers and look for patterns. Keep an eye out for both the big wins and the areas that clearly need some work.
For example, you might see that quiz scores are sky-high, but on-the-job application is lagging. That’s a classic disconnect between knowing and doing. This is a golden insight your instructional design team can jump on right away.
Or maybe you notice that one microlearning module, created with Articulate Suite, has a fantastic 95% completion rate, while another is stuck at a dismal 40%. That’s telling you something important about the content's engagement or relevance. Now you can dig in and figure out why. Maybe the popular module used more realistic, scenario-based learning—a technique you can definitely use again.
Don’t just look at data in a vacuum. Cross-reference your results between different teams, job roles, or even regions. You might discover that a program that was a home run for the sales team completely missed the mark for customer support. That’s a clear signal you need more tailored content.
Finding these opportunities for improvement is just as valuable as celebrating your successes. This continuous feedback loop is exactly what helps your training programs evolve and get better. In fact, understanding these gaps is a fundamental part of building a strong L&D function, and it often starts long before a program is even created. You can dig deeper into this with our comprehensive training needs assessment template.
Let's be real: nobody has time to read a 50-page report. When you’re sharing your results, your audience is busy. Your mission is to make the key takeaways clear, concise, and compelling. You’re telling a story, not just handing over a spreadsheet.
Focus on building simple, visual dashboards that shine a spotlight on the most important metrics. You want to clearly show the link between the training and its impact on the business.
Here’s how you can frame your findings to make a real splash:
When you turn your data into a clear, actionable story, you cement your role as a vital business partner who helps drive strategy, not just someone who checks off tasks.
When you start digging into training measurement, a few questions always seem to surface. Let's clear up some of the most common ones I get asked. Getting these straight can save you a ton of headaches down the road.
This is a big one, and it’s easy to get them mixed up.
Think of training efficiency as being all about your resources. It’s the "how" of your training operations. Are you being smart with your budget? Are you turning courses around quickly? We're talking metrics like cost-per-learner or how long it takes your team to build a module in a tool like Articulate. It’s about doing things right.
Training effectiveness, however, is all about the outcome. Did the training actually work? Did people learn something, change how they do their jobs, and ultimately move the needle for the business? This is about doing the right things. You can run an incredibly efficient program that's a total flop because it didn't solve the problem it was supposed to.
You want to start right away, but the biggest mistake is stopping there. Measurement isn't a one-and-done event; it's a process that unfolds over time.
Immediately after the training wraps up, get that initial reaction (this is Kirkpatrick's Level 1). A quick poll or survey in your LMS or LXP is perfect for this. Within a week or so, follow up with a quiz or assessment to check for knowledge retention (Level 2).
But the real story emerges later. You need to give people time to actually use what they've learned. I recommend checking in around the 30- to 90-day mark to observe behavior change on the job (Level 3). As for those big business results (Level 4)? Those can take a quarter or even a year to really show up in metrics like sales figures or productivity reports.
Timing is everything. Measuring too soon only gives you a fraction of the story. The long-term impact is where you'll find the most compelling evidence of your training's value.
Yes, you absolutely can! It just requires a bit more creativity than measuring, say, how to use a new software. You'll lean more on qualitative feedback and observation rather than simple tests.
You can't just give someone a multiple-choice quiz on empathy. Instead, you have to look for evidence that they're applying it. Here are a few ways I’ve seen this work really well:
It’s less about finding one perfect number and more about weaving together a narrative from multiple data points. When you put them all together, they tell a powerful story of real improvement.
Ready to create training content that not only gets your team excited but also delivers results you can actually prove? At Relevant Training, we specialize in developing and updating elearning that makes a real impact.